Welcome to the Prometheus Series, in the previous post we learned about Prometheus briefly. In this article, we’ll take a closer look at the concepts of Prometheus and its architecture, and then we’ll install and configure a simple Prometheus.
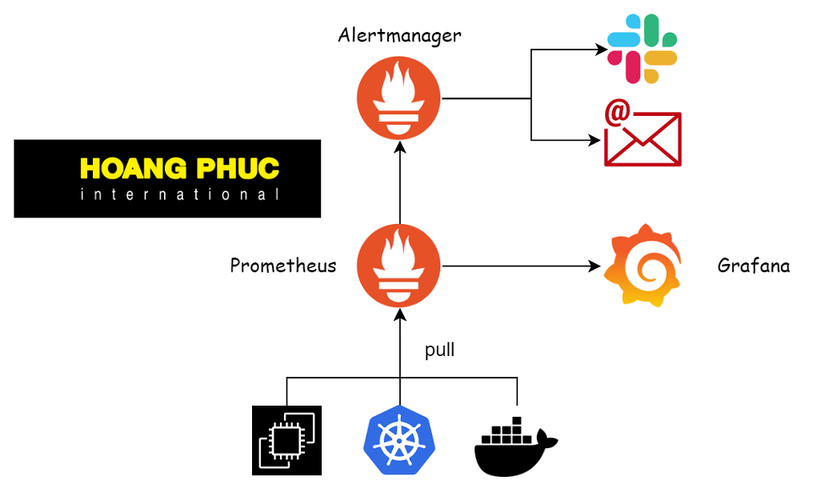
As we said in the previous post Prometheus is a specialized tool for monitoring the system by collecting health data of applications, so how will Prometheus do that?
How does Prometheus work?
Prometheus will actually collect data by pulling data from the infrastructure or applications it needs to monitor. The infrastructures and applications that Prometheus monitors are called targets, which are defined in the Prometheus configuration file.
The targets need to provide an HTTP endpoint, then Prometheus pulls the data by calling the endpoints and saves the result returned by the endpoint, which is called time series data.
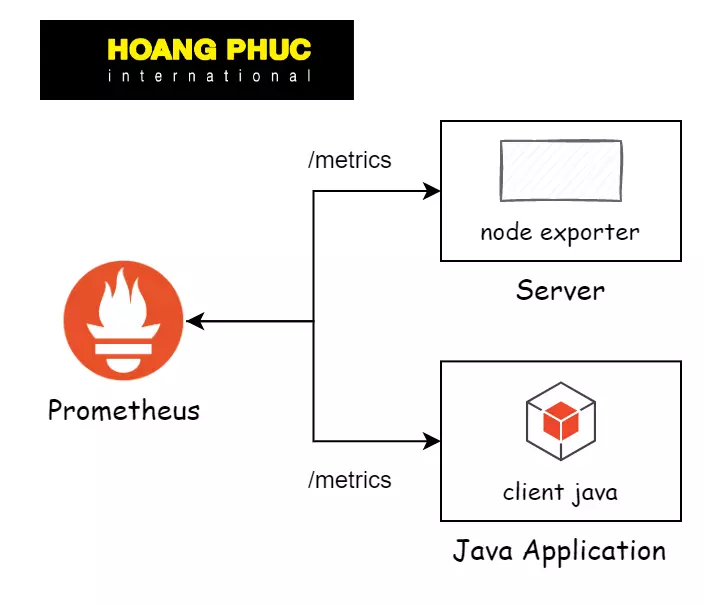
For targets to provide time series data, there are two ways:
- For infrastructure, we will use a tool called exporters, for example
prometheus/node_exporterfor the server. - For the application, we will install the corresponding library in that application, for example, for the JAVA application, we will use
prometheus/client_java.
We will often hear the term metrics, which simply explains metrics as a collection of multiple time series that have the same name. To better understand the time series and metrics returned from the targets, we will learn how the data is formatted.
Prometheus Data Model
For example, a time series returned from the target has the following value:
container_cpu_load_average_10s{id="/docker", instance="10.0.2.15:8080", job="docker"} 0
The format of the data above is as follows:
<metric name>{<label name>=<label value>, ...} <samples>
Here are the terms you need to remember when going to the interview:
- The part
<metric name>{<label name>=<label value>, ...}is called notation, it is the set of metric names and one or more labels, notation will be used to define a time series. - The part
<samples>is called Samples, it is the data of the time series, its value is a number of data type float64. - Part
<metric name>is the name of the metric. - The
section {<label name>=<label value>, ...}will contain a collection of labels, one label is data type key-value pairs.
For example, the above data we will have container_cpu_load_average_10s is metric name, id="/docker" is a label with key id and value docker, the notation to define the above time series is container_cpu_load_average_10s{id="/docker", instance="10.0.2.15:8080", job="docker"}, and its data is 0.
When Prometheus calls the endpoint of a target, there will be a lot of time series data as above returned, then Prometheus will save that data, and Prometheus will provide us with a set of tools to query that data, Or use another tool to query the data and represent it in a graphical form so that we know the status of the system and the application.
Querying data, Alert and Visualization
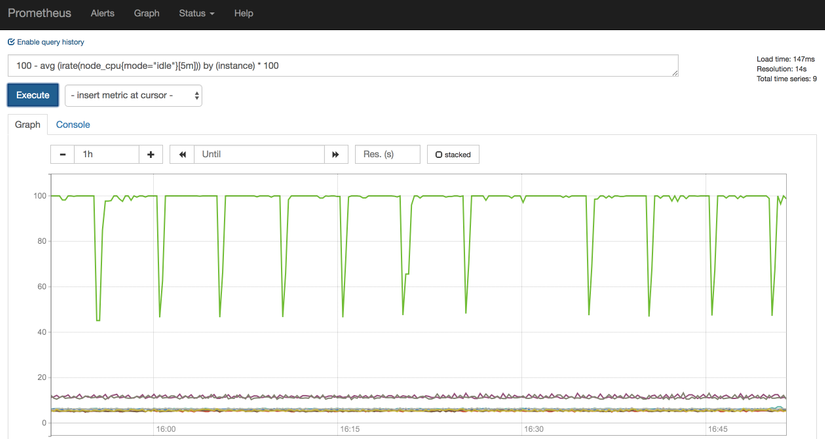
To query data in Prometheus we use PromQL language, Prometheus provides us with an Expression Browser for us to type queries.
We cannot always turn on the computer and observe the system, we need an alarm system, Prometheus provides us with the Alertmanager toolkit. If there’s something amiss in my system, Prometheus will notify us through Alertmanager.
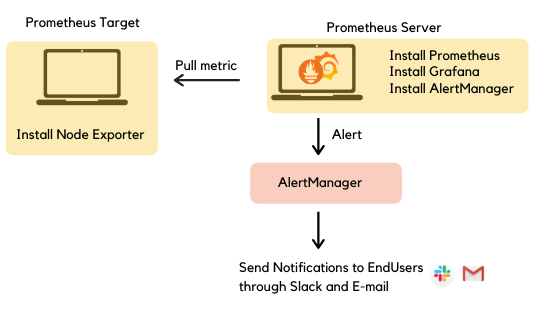
And finally, to represent the data on the chart, we will use Grafana.

We will learn about querying data, alerting, and visualization in the following articles. Now we will proceed with a simple Prometheus installation and configuration.
Installing Prometheus
In this series, I will guide you on a Linux environment, you can install a virtual machine to practice this series, to install Prometheus, we can use the Linux package or docker.
To install using a Linux package, you go to the Prometheus Download page and find the package suitable for your OS, for example with Centos.
wget https://github.com/prometheus/prometheus/releases/download/v2.39.0/prometheus-2.39.0.linux-amd64.tar.gz
If you don’t have wget, you install it, next we extract the downloaded file above.
tar -xzf prometheus-2.39.0.linux-amd64.tar.gz
sudomv prometheus-2.39.0.linux-amd64/prometheus /usr/local/bin/
There is also another tool in the folder prometheus-2.39.0.linux-amd64 that is quite useful, the promtool binary, which we will use to check the syntax of the Prometheus configuration file.
sudomv prometheus-2.39.0.linux-amd64/promtool /usr/local/bin/
Check if we have successfully installed it.
prometheus --version
prometheus, version 2.39.0 (branch: HEAD, revision: 6d7f26c46ff70286944991f95d791dff03174eea)
  build user:       root@bc053716806f
  build date:       20221005-05:09:43
  go version:       go1.19.1
  platform:         linux/amd64
Ok, so we have installed Prometheus successfully, next we will run Prometheus with a simple configuration.
Configuring Prometheus
The Prometheus configuration is written in the YAML file, its default configuration is in the folder prometheus-2.39.0.linux-amd64 with the name prometheus.yml we unzipped it above, let’s take a look at it.
cat prometheus-2.39.0.linux-amd64/prometheus.yml
# my global configglobal:scrape_interval: 15s # Set the scrape interval to every 15 seconds. Default is every 1 minute.evaluation_interval: 15s # Evaluate rules every 15 seconds. The default is every 1 minute.# scrape_timeout is set to the global default (10s).# Alertmanager configurationalerting:alertmanagers:-static_configs:-targets:# - alertmanager:9093# Load rules once and periodically evaluate them according to the global 'evaluation_interval'.rule_files:# - "first_rules.yml"# - "second_rules.yml"# A scrape configuration containing exactly one endpoint to scrape:# Here it's Prometheus itself.scrape_configs:# The job name is added as a label `job=<job_name>` to any timeseries scraped from this config.-job_name:"prometheus"# metrics_path defaults to '/metrics'# scheme defaults to 'http'.static_configs:-targets:["localhost:9090"]The default configuration file has four main configuration sections: global, alerting, rule_files, and scrape_configs.
Global
The global section contains global configurations for the entire Prometheus.
The field scrape_intervaldefines how long Prometheus will pull data once, we specify 15 seconds above.
The field evaluation_interval defines how long Prometheus will re-evaluate the rule once, temporarily we do not need to care about this configuration.
Alerting
The alerting section contains the configuration of the tool that we will send an alert to if there is a problem with our system, as mentioned above for Prometheus, we will use Alertmanager. Right now we don’t need to use an alert, so we close it with a #.
Rule files
The rulefiles section will contain a configuration that defines the rule when Prometheus will need to fire an alert via the Alertmanager and the rules about recording, which we will learn about later.
Scrape configuration
The part that we are most interested in right now is scrape_configs, this is the configuration for us to define the targets that we will need to monitor.
scrape_configs:-job_name:"prometheus"static_configs:-targets:["localhost:9090"]The attribute is job_name used to define the name of the target we monitor, here we set it as “prometheus”.
The targets attribute is used to define the address of the target, which will be an array of addresses.
The default configuration of Prometheus is to monitor itself, when you run Prometheus it will listen on port 9090 and provide a path/metrics for us to get its metrics.
curl localhost:9090/metrics
So in the above configuration, the job_name attribute we named “prometheus” and the targets we filled in the address was localhost:9090, by default the path that Prometheus will call is /metrics, if our target has a different path, we will specify it with the metrics_path, for example:
scrape_configs:-job_name:"nodejs-server"metrics_path: /other-path
    static_configs:-targets:["localhost:3000"]
Prometheus will pull the data through the endpoint localhost:3000/other-path.
Running Prometheus
We will now run Prometheus, but before that, we should move the configuration file to a more appropriate folder.
sudomkdir -p /etc/prometheus
sudomv prometheus-2.39.0.linux-amd64/prometheus.yml /etc/prometheus/
Create the directory /etc/prometheus and move the configuration file into it, then run the Prometheus server.
prometheus --config.file "/etc/prometheus/prometheus.yml"ts=2022-10-05T07:21:29.148Z caller=main.go:500 level=info msg="No time or size retention was set so using the default time retention"duration=15d
ts=2022-10-05T07:21:29.148Z caller=main.go:544 level=info msg="Starting Prometheus Server"mode=server version="(version=2.39.0, branch=HEAD, revision=6d7f26c46ff70286944991f95d791dff03174eea)"...
If you can see that it returns a bunch of time series data, then you’ve got the Prometheus server up and running. If you open the browser and access the address of your virtual machine with port 9090, we will see the UI of Prometheus.

Run a test query up{job="prometheus"}, here is the time series to let us know if our target is still alive.

If we see that Prometheus UI returns data, then we have succeeded 😁. If you do not use a virtual machine, we can quickly practice using docker to run, simply with a few commands as follows.
docker network create local
docker run --name prometheus --network local -p 9090:9090 -v /etc/prometheus:/etc/prometheus -d prom/prometheus
You can choose to run with a Linux package or docker, I will guide you in both ways throughout this series. If you choose to run with docker, you should run the command docker network create local to create a network named local, we will need it in the following articles.
Done 😁.
Conclusion
So we’ve covered the basics of Prometheus and how to install it. If you have any questions or need more clarification, you can ask in the comment section below.
Nguồn: viblo.asia
