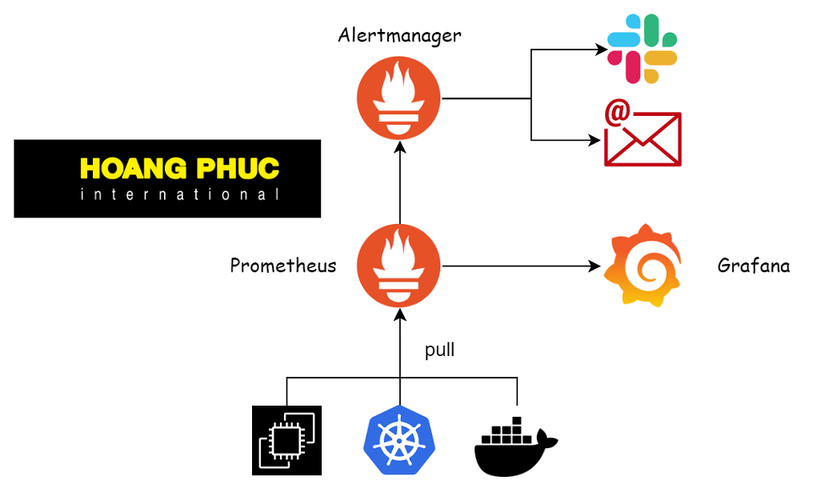
Welcome to Monitoring with Prometheus Series. In this series we will learn about how to monitor the system using the Prometheus tool, probably most people learn Prometheus by installing it on Kubernetes, in this series we will not do that. I will show you how to use Prometheus from start to finish, from how to install Prometheus with Linux packages, how to install tools to provide metrics for Prometheus on virtual machines, and containers, to how to design the system Alertmanager and Prometheus extension configuration, and many more are different 😁.

This series I refer to from the book Monitoring with Prometheus.

In the first lesson, we will learn what is the concept of Monitoring.
What is Monitoring?
From a technical perspective, monitoring is how we use tools to monitor our systems and applications. Monitoring will provide us with values about the performance, health of the system, and application so that we can quickly detect problems with the system.
But monitoring does not stop at just monitoring system values such as CPU or memory but also includes values that can help in business terms such as the number of customers accessing the website and the time of customers. website stay, the number of customers clicking on a certain product, …
So for monitoring, we will have two objects:
- The system (the system)
- Business (the business)
System Monitoring
For a system, we need to monitor the following components:
- Infrastructure monitoring: first in a system, we need to monitor the infrastructure because this is where applications are deployed, the values of the infrastructure we need to care about are how much CPU and memory are left in the infrastructure, How much disk space is left, processes are running on the infrastructure alive or dead, …
- Application monitoring: next, we need to monitor the parameters of the application, for an application, we will care about values such as the application’s response time, and the application’s status (running or dead), CPU and application memory, the number of requests (requests) to the application in 1 second, …
- Network monitoring: Finally, at the network layer, we need to care about values such as the number of incoming and outgoing bytes, the status of the firewall, …
Business
As we said above, business-related values are usually values of user interaction. Analyzing user interactions will bring great value to our business.
To monitor user interaction, we need to do it at the front-end or back-end code layer, for example, at the front-end layer to track user behavior we will use Google Analytics.
In this series, we will talk about monitoring at the system monitoring.
Monitoring Mechanism
For monitoring, we will have two approaches: probing and introspection.
Probing monitoring is a way we monitor the system from the outside, we will make a request to the system and collect the values it returns, such as whether the system responded to the request, and whether the system is open or not. the port we need, the system returns the correct HTTP code or not. For example, we make a call to an API and check the HTTP code it returns is 200 or not.
Introspection monitoring is how we monitor the system from the inside, we will use tools to collect values about the performance and health of the system. In the next lessons, we will learn about introspection monitoring first and then go to probing monitoring.
How to monitoring tool collects data
Usually, monitoring tools use two ways to collect data from the objects it needs monitoring: pull-based and push-based.
Pull-based: In this way, the systems that we need to monitor must provide a path that when we call that path will return us values representing its status. The monitoring tools will then call this path to collect data. For example, our application provides a path /metrics for monitoring tools to call and retrieve data.
Push-based: In this way, on the contrary, our monitoring tool will provide a path and our applications will push its values to this path.
In this series we will learn about Prometheus, it supports both pull-based and push-based ways.
Prometheus
Prometheus is a specialized tool for system monitoring, at the time of writing this article, it is the most popular tool. Prometheus will collect and store system parameters under its database, the values it collects will be stored under Prometheus in time series form. You can think of Prometheus as a time series database.
Prometheus Key Features:
- A multi-dimensional data model with time series data identified by metric name and key/value pairs
- PromQL, a flexible query language to leverage this dimensionality
- No reliance on distributed storage; single server nodes are autonomous
- Time series collection happens via a pull model over HTTP
- Pushing time series is supported via an intermediary gateway
- Targets are discovered via service discovery or static configuration
- Multiple modes of graphing and dashboarding support
In the next article, we will learn about how to install Prometheus.
Conclusion
Then there are the important concepts about monitoring that I know, if you have any more suggestions, please write them in the comments to help me, see you in the next post of the series 😁.
Nguồn: viblo.asia
